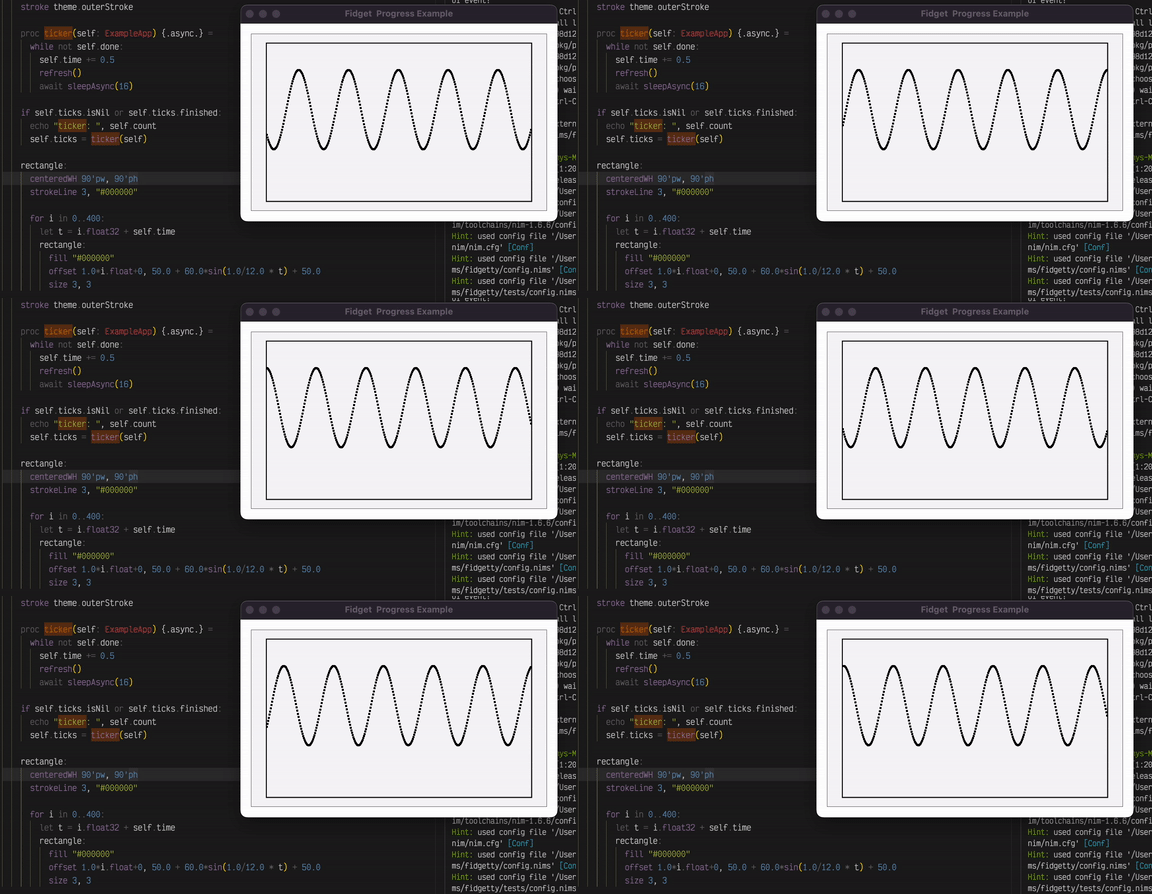
I'd like to try and do some live graphing in Fidget (2d plots). I could draw my own but I'd need a method to draw lines. There's linePolygon but it draws a closed polygon line.
I don't know much about OpenGL. Would it be easy to change linePolygon to just lines? Alternatively would it be possible to use an existing OpenGL plotting library and have it render part of the window?
Hmm, boxy is more for using pre-rendered images. Though I could use pixie to draw plots as images and use those.
But I'd like to do be able to do real time charting. Also doing it with native Fidget elements could make it more interactive.
Looks like it wouldn't be too hard (TM) to add GL_LINES to the Fidget OpenGL setup.
However, for my use case a "scatter plot" actually suffices, so I can just use regular rectangle nodes. I have some basic scatter plot code I wrote in Elixir so I'll probably just port it over. For more advanced graphs I think pixie would be excellent.
Here's a demo:

And optimized it! The CPU usages wasn't bad, around 20%. But I optimized it by making the drawable node just draw a list of points. Now even with 3,200 points at 30fps only uses 10% CPU.
template drawable*(id: string, inner: untyped): untyped =
## Starts a drawable node. These don't draw a normal rectangle.
## Instead they draw a list of points set in `current.points`
## using the nodes fill/stroke. The size of the drawable node
## is used for the point sizes, etc.
##
I don't recommend GL_LINES, they are not very flexible and look ugly. Drawing good lines with direct openGl is kind of hard.
Yah it's sunk in that drawing lines in OpenGL isn't really a thing..
"boxy is more for using pre-rendered images" - so is fidget. linePolygon just uses pixie to draw the line into an image, then uploads the image. I recommend using pixie to draw the full chart use that.
Good points, adhoc image plots using linePolygon was surprisingly fast.
This experiment has gotten me onto the path to make a native chart library using Pixie! Then I can generate the background, the axis, legends, etc. The current native options in C et all kind of suck. :/
I still want to have "live plots" using just basic Fidget nodes. But a pixie based ploting lib as a base would make it easy to write interactive live plots as an additional layer on top. Using the drawing element like I did would let anyone write interactive visualizations akin to D3.
So for that plot-lib I'd like to make the core drawing logic based on Pixie. The API for pixie is an excellent API for that IMHO. With some Nim work I should be able to intercept the API to do live plotting elements as well.
But meanwhile, back to work.