I'm using pixie to render charts with small labels, and I'm struggling with font quality at sizes ≤12px. The text appears blurry compared to native OS rendering or html canvas (Windows ClearType/macOS CoreText). This isn't a bug report, pixie works great as-is, just looking for enhancement ideas or user-discovered techniques to push small font quality further.
I've tried the common approach of rendering text at larger sizes (2x or 4x) and then downscaling the final image, but the results aren't very convincing, sharpness is lost and artifacts appear.
If you've found a practical approach, whether preprocessing, specific font choices, or compositing tricks, I'd love to hear your workflow.
I can share a side-by-side comparison image if helpful, though I realize the perceived quality may vary depending on display DPI, subpixel layout.
Thanks for any pointers.
Pics please. We should look nearly identical to macOS CoreText at small scales.
You might be used to Windows ClearType, which I think butchers the letters and does not stay true to how they should look. Also they might do LCD tricks that look good on some monitors but bad on others.
This is at 11 pixels:

Thanks for the answers.
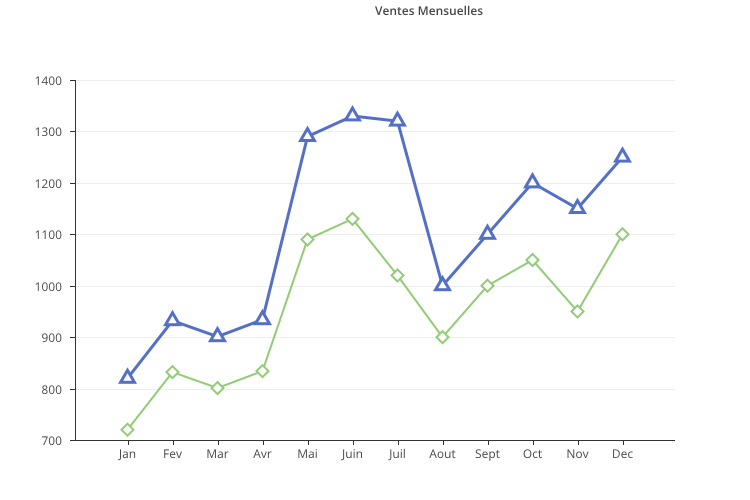
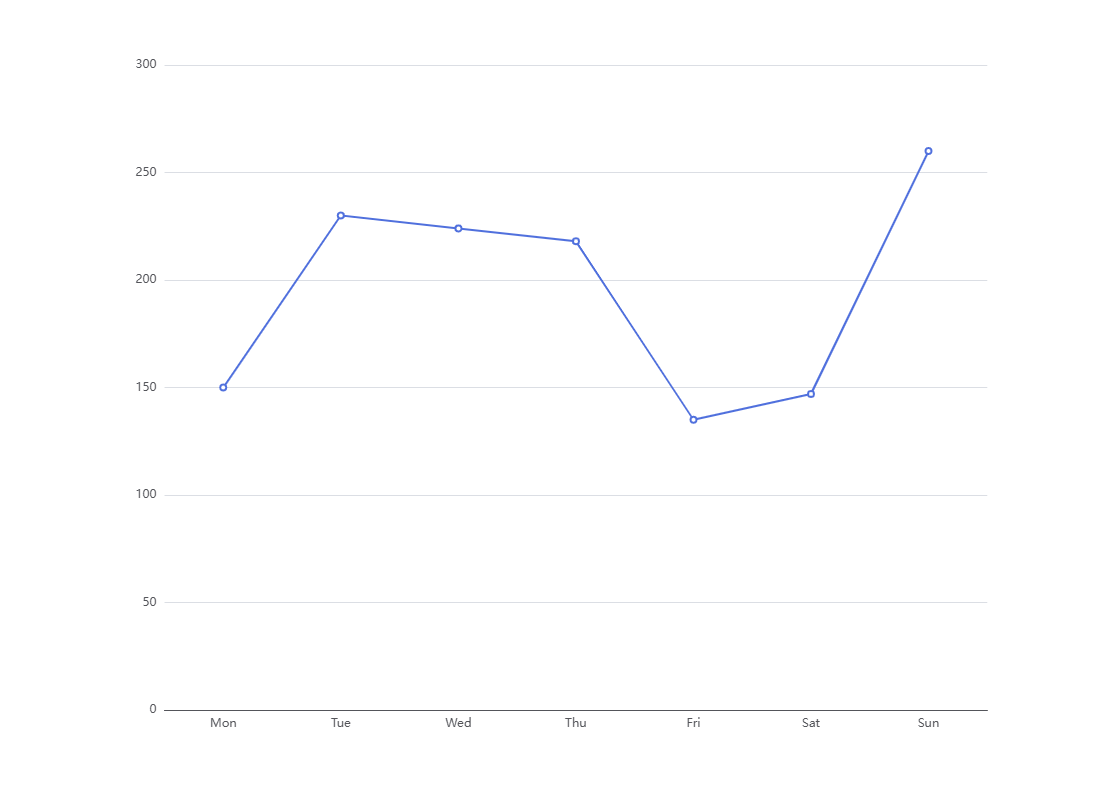
I am trying to reproduce this type of chart from echarts : https://echarts.apache.org/examples/en/editor.html?c=line-simple
The link below for the pixie output (which I think accurately reflects what I see on the screen rather than the PNG file) https://ibb.co/1fkYvRkP
png link (bad, but it's not the reality): https://i.ibb.co/jvS963SQ/line.png
The link below for the echarts output (which I think accurately reflects what I see on the screen rather than the PNG file) https://ibb.co/tpHBFjsm
png link (bad, but it's not the reality): https://i.ibb.co/4RFW3vTm/echarts.png
Most fonts are not designed to look good at small scales. Maybe a special purpose font like https://tobiasjung.name/profont/ would work better for you?
I'll try it to see if it's better.
- The ImageBB page (first link) shows the image scaled down in my browser, which looks sharper and more similar to what I see in my actual application.
- The direct PNG link looks worse when viewed at 100% zoom in the browser (or when opened in an image viewer at native resolution).
I realize the ImageBB links above were misleading, they display the image in a viewer that resizes it, which doesn't show the actual pixel data.
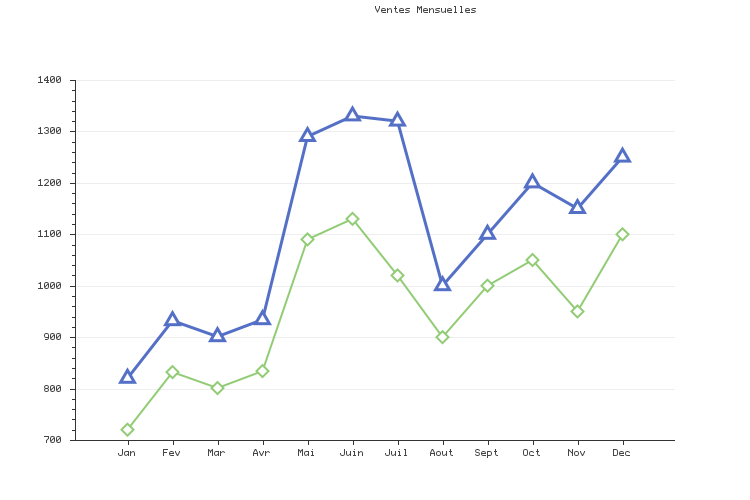
Here's a direct link to the raw PNG file (exactly as output by Pixie): https://files.catbox.moe/5yxo78.png
And the ECharts reference: https://files.catbox.moe/5lc0zg.png
These are the unmodified files at 100% scale.
Actually, looking at the raw PNG files side by side, I don't think this is an display pipeline issue.
Most fonts are not designed to look good at small scales. Maybe a special purpose font like https://tobiasjung.name/profont/ would work better for you?
It's much better, even though I'm not a fan of the font, it's definitely better. https://files.catbox.moe/whynev.png
The images look pretty low-dpi. I recall having to set the DPI or some other setting in matplotlib so png exports would look good on a high dpi Mac.
Does pixie have a dpi setting for pngs?
Pixie does not have DPI. DPI is only useful for vector formats. Pixie rasterizes stuff into pixels. The "DPI" is what you scale your vector at when drawing so that would sit above the Pixie layer.
PNG's do have a DPI setting though. Obviously the number of rasterized pixels remains the same but PNG viewers/printers use the info on high DPI displays to match the DPI of the output:
https://slar.se/set-png-dpi.html
Pixie can read SVGs and that has a scale parameter you can sort of use as DPI, but its not what is happening here.
You're right about the fonts. The Pixie output looks good to me!
I'm noting for @zack that for higher quality plot rendering (and small fonts) it's possible to generate a higher resolution plot and increase the DPI. It'll make the fonts look better on high DPI displays that most Mac's have.
Here's how you can set DPI in Matplotlib and Jupyter: https://blakeaw.github.io/2020-05-25-improve-matplotlib-notebook-inline-res/
Though for low DPI screens it'll downscale, so using a better font for small sizes still makes sense.
Sorry I don't see a manful difference in the font rendering between the two images. They are different fonts and color. Pixie one is slightly lighter color, and smaller lighter font over all, the ECharts font is just slightly larger with a darker bluer color. Can you get them to use the same font and color? I bet they would be nearly identical then?
I tried my best to get as close as possible to echarts :
<text dominant-baseline="central" text-anchor="end" style="font-size:12px;font-family:Microsoft YaHei;" transform="translate(156.55 495)" fill="#54555a">100</text>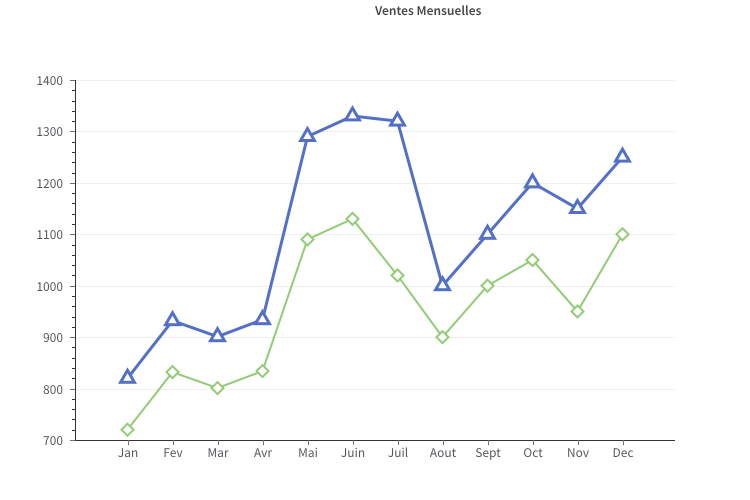
I find that the number ‘0’ is the least attractive of all the numbers. If you have a method for improving the numbers ? I'm open to suggestions.
You're probably right, I'm getting closer to Echarts, but I'm still not satisfied.I expected to have the same font quality as when, for example, we open an SVG file and zoom in and out. It's not Pixie's fault, as I said in my first message.
@elcritch , thanks for the advice.
I also notice that for an identical text placed at different coordinates, it does not render the same way. This must also be taken into account. It is not easy to place text on an image.
In any case, thank you for your answers and advice.